
Monitoring
Application Programming
Interface

|
Monitoring
Application Programming
Interface
|
|
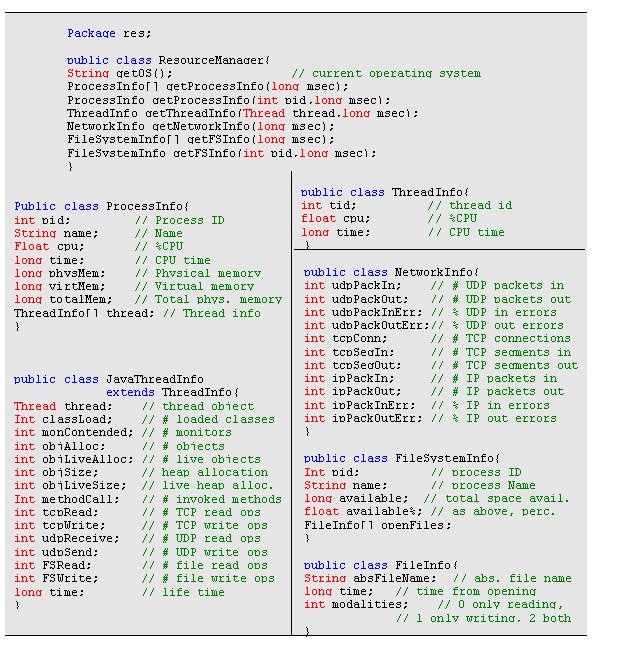
MAPI methods return either an object or an array of objects of the three classes ProcessInfo, NetworkInfo, and FileSystemInfo shown in Figure 2.
The ProcessInfo object maintains all data related to the current pid process. Monitored data include the CPU usage (percentage and total time) for any specified process, its allocated memory (physical and virtual), and miscellaneous information on its composing threads. In addition, for JVM threads, MAPI maintains the reference to the Java thread object, its lifetime, and the number of loaded classes, used monitors, allocated objects, invoked methods, network and file system operations. For non-Java threads, MAPI provides the thread identifier and the percentage/effective time of CPU usage.
The NetworkInfo class reports aggregated monitoring data about the usage of the communication infrastructure on the target host. Monitored data include the total number of sent/received UDP/IP packets, of TCP connections and sent/received segments, the percentage of UDP/IP packets received with errors, and the percentage of discarded UDP/IP output packets. These parameters permit to give an overall evaluation of the host traffic conditions and to identify congestion situations.
Finally, the FileSystemInfo class maintains general information about the file system of the target (disk free space and its percentage on total size) and detailed data about currently opened files. In particular, for any active process and for any file opened in the current session, the class returns the opening time and its opening mode (read/write/both/locked).
The MAPI Profiler Agent Implementation
The MAPI Profiler Agent permits to configure dynamically the JVMPI-based event notification and to provide the ResourceManager class with concise monitoring indicators, obtained by filtering the history of previous performance. In a more detailed view, the MAPI Profiler Agent gives the possibility to change the set of notifiable events with no suspension of the monitoring execution, by implementing methods to enable/disable the event notification related to object allocation/deallocation, method invocation/exit, and lock/unlock of Java monitors. It keeps and updates statistics of the monitored events to provide immediately readable indicators with no need to maintain huge logs of monitoring data. For instance, the profiler traces only the size of the total memory allocated to the threads of a SOMA agent and does not log their full data due to the execution of any system call for memory allocation. In addition, the refresh interval of monitoring indicators can change dynamically to tune the MAPI intrusion depending on service-specific constraints and run-time conditions (see the performance page).
Figure 3 sketches a piece of the MAPI Profiler Agent code. When a registered event occurs, JVMPI signals an event ev to the profiler that performs event-specific actions. In particular, the figure shows the initializations done when the class SocketInputStream is loaded. After initializing the internal socketread variable, the profiler can trace any invocation of the method socketRead() by incrementing the stat->tcp_read counter, which maintains the account for the TCP read operations of any SOMA agent in a specified time interval. These data represent a rough estimation of the incoming network traffic produced by Java service components. If more precise information about the traffic due to specific Java threads is needed, ResourceManager can command the MAPI Profiler Agent to examine dynamically the invocation parameters of the socketRead()/socketWrite() methods. This is possible by setting at the maximum level of detail (JVMPI_DUMP_LEVEL_2) the triggering of JVMPI_EVENT_OBJECT_DUMP for the specified objects. The default of the MAPI Profiler Agent, of course, is different to avoid the excessive overhead of the dynamic generation and processing of object dumps.
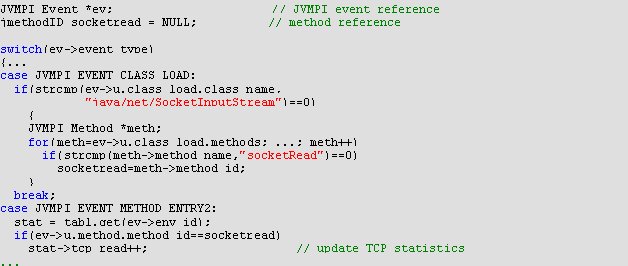
Figure 3. Monitoring the invocation of the socketRead() method in MAPI Profiler Agent.
|
|
|||||
|
|
|
|
|
||
|
Page
updated on
|
In
case of problems, or if you find any bug, please contact us.
|
||||