
Monitoring
Application Programming
Interface

|
Monitoring
Application Programming
Interface
|
|
To validate the applicability of the MAPI-based distributed monitoring and control to mobile agents, we have measured the overhead of the MAPI component on different platforms, e.g., Intel PentiumIII 600MHz PCs with either Microsoft Windows NT 4.0 or SuSE Linux 6.2, and SUN Ultra5 400MHz workstations with Solaris 7. The hosts are interconnected via 10 Mb Ethernet Local Area Networks (LANs).
With regard to the MAPI Profiler Agent and the MAPI*ResManager, we have used a Java benchmark application that stresses CPU and memory usage by generating a fixed number of different threads and objects. In particular, the measurements reported in the following refer to the case of 50 benchmark processes in execution, each one with an average number of 5 threads. We have measured the overhead of the two modules depending on the time period to refresh monitoring indicators. We define the overhead percentage (Overhead%) introduced by the monitoring tool as:
![]()
where TMon and TnoMon are the average completion times of the Java benchmark on unloaded targets, respectively, with and without the MAPI tool in execution. Let us note that unloaded targets represent the worst possible case for Overhead%. In fact, as soon as the load increases, TnoMon grows faster than Tmon, and their ratio consequently tends to decrease. This has been validated by taking Overhead% measurements with several general-purpose benchmark tests running: the measurements have confirmed the expected behavior, with an average decrease of about 1.0-1.5% of the Overhead% parameter in conditions of average load.
Figure 5 depicts the Overhead% introduced by the MAPI*ResManager to monitor all the information contained in ProcessInfo for the three supported platforms. The diagram of Overhead% is drawn function of the refresh time that represents the interval between two successive invocations of the native monitoring modules via JNI. Overhead% exhibits a linear dependence on the reciprocal of the refresh time. We have obtained analogous trends in intrusion measurements in case of native monitoring of NetworkInfo and FileSystemInfo. In general, all tests show that the MAPI*ResManager causes a limited overhead (Overhead% lower than 3%) when the refresh time interval is greater than 3 seconds. This can be considered acceptable because the refreshing of monitor indicators with this time period is sufficient for the enforcement of most resource usage policies. In fact, native modules continuously collect monitored events, and the refresh interval represents only the period between successive interrogations of native monitoring results.
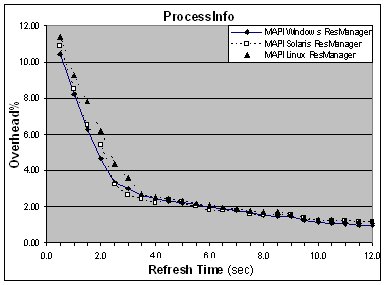
Figure 5. Overhead% of MAPI*ResManagers for process monitoring.
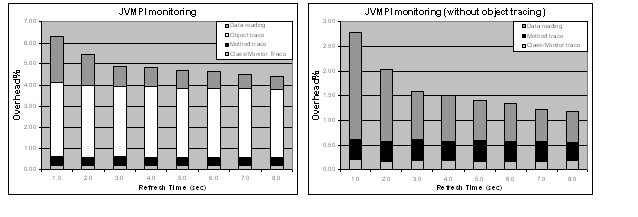
We have also measured the overhead introduced by the MAPI Profiler Agent. In this case, the JVM notifies continuously certain kinds of events (not only at polling times), and the refresh time represents the interval to process the collection of observed events in order to obtain the desired concise monitoring indicators. Figure 6 depicts the different contributions of the Overhead% related to data access and to the JVMPI notification mechanisms, i.e., monitor, method and object tracing. The results obtained for the Solaris platform are very similar to the ones for Windows NT and Linux, with differences lower than 3% of the maximum Overhead%. The figure shows that the JVMPI notification is scarcely intrusive under different load conditions and independent of refresh times. The refresh time affects only the overhead due to the processing of collected events and to the reading of MAPI indicators. Object tracing has shown to be the most relevant factor in the MAPI Profiler Agent intrusion because of the large amount of data it requires to receive and collect in the profiler. In any case, the total overhead can be kept under 2.0% when the refresh interval is greater than 2 seconds and object tracing is disabled.
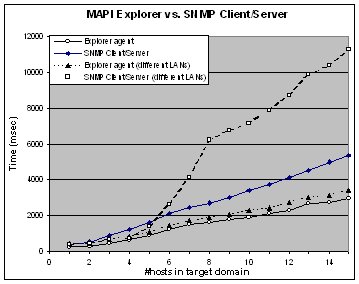
Finally, we have considered the distributed monitoring and control of SOMA agents, which exploits mobile Explorer agents to migrate and to interrogate locally the MAPI modules. The size of Explorers vary from about 8kB (at the first migration, without carrying any monitoring indicator) to 15kB (at the end of exploration, including all the monitoring state of the target domain). Figure 7 reports the time an Explorer needs to collect monitoring indicators by using MAPI SNMP Agents, depending on the number of hosts in the target domain. The MAPI SNMP Agent filters and pre-processes the monitoring data to collect. For several policies about MA resource consumption, we have experienced that the MAPI SNMP Agent operations significantly reduce the size of MAPI indicators collected by the Explorer with respect to the size of corresponding raw MIB values (1:3 reduction). This optimization is impossible in a traditional Client/Server approach where a fixed and centralized manager remotely interrogates the different SNMP agents involved (SNMP C/S graph in the figure). In addition, the MA technology is particularly suitable when the target domain includes different LANs, interconnected by low bandwidth links (in our measurements, two Ethernet LANs with n/2 hosts and connected via a 56kb modem link). In this case, Explorer uses the slow link only once to migrate from one LAN to the other, while the C/S solution should use the link at least in n/2 SNMP requests and n/2 SNMP replies, wherever the centralized manager is located.
 |
 |
|
Figure
6. Overhead% of the MAPI Profiler Agent.
|
Figure
7. MAPI Explorer vs. SNMP Client/Server to monitor SOMA agents in
one target domain.
|
|
|
||||
|
|
|
|
||
|
Page
updated on
|
In
case of problems, or if you find any bug, please contact us.
|
|||